Linear Regression is type of supervised machine learning technique. ‘Supervised Machine Learning’ is a machine learning technique where many independent predictors are used to predict a target variable. Using this technique you can find a precise equation using independent predictors to find your outcome target variable.
In supervised machine learning techinque, you train you machine learning model by supervising the training data. Training data consists of many rows of independent predictors and each row has a corresponding target outcome varibale. Our machine learning model learns rule/equations by finding out the closest relation between the independent predictors/features and target outcome variable. Then, you give it some new test data to predict the outcome target variable. This trained model predicts values for test data based on what rules it learnt by analzying the training data.
You can see how to do Linear Regression to predict the House prices, here.
The most important term here is Residual(Error). Residual is the difference between the actual and predicted value of the outcome target variable. Most of the metrics below are obtined from this Residual term.
There are many metrics to evaluate your ‘Linear Regression Model’ which are as follows:
- Mean Absolute Error(MAE)
- Mean Squared Error(MSE)
- Root Mean Squared Error(RMSE)
- Relative Absolute Error(RAE)
- Relative Squared Error(RSE)
- R-squared(Co-efficent of Determination)
Out of all these, RMSE and R-squared are the most important metrics to understand how well your model fits your data. Depending on your problem dataset some metrics are more useful to understand how your model performs. Let us understand what these metrics mean.
Mean Absolute Error(MAE)
Mean absolute error can be obtained by taking summation of the absolute value of (residuals)differences between the predicted and the actual values and then taking a mean of it. It gives an idea about the magnitude of error in the predictions. It can also be called as “Mean of Residuals”.
Mean Squared Error(MSE)
Mean squared error can be obtained by taking summation of square of (residuals)differences between the predicted and actual values and then taking a mean of it. It is a measure of how close a fitted line is to data points. The smaller the Mean Squared Error, the closer the fit is to the data.
Root Mean Squared Error(RMSE)
Root mean squared error can be obtained by taking a root of mean squared error. In other words, it is the standard deviation of residuals. RMSE is similar to MAE but it amplifies and severly punishes large errors. RMSE can be interpreted more easily because it has the same units as the vertical axis(target value).
Relative Absolute Error(RAE)
RAE can be defined as a absolute error(taking the absolute value of residual) as a fraction of the actual value of the outcome target variable.
Relative Squared Error(RSE)
RSE can be defined as the squared error(residual^2) as a fraction of the actual value of the outcome target variable.
R-squared(Co-efficent of Determination)
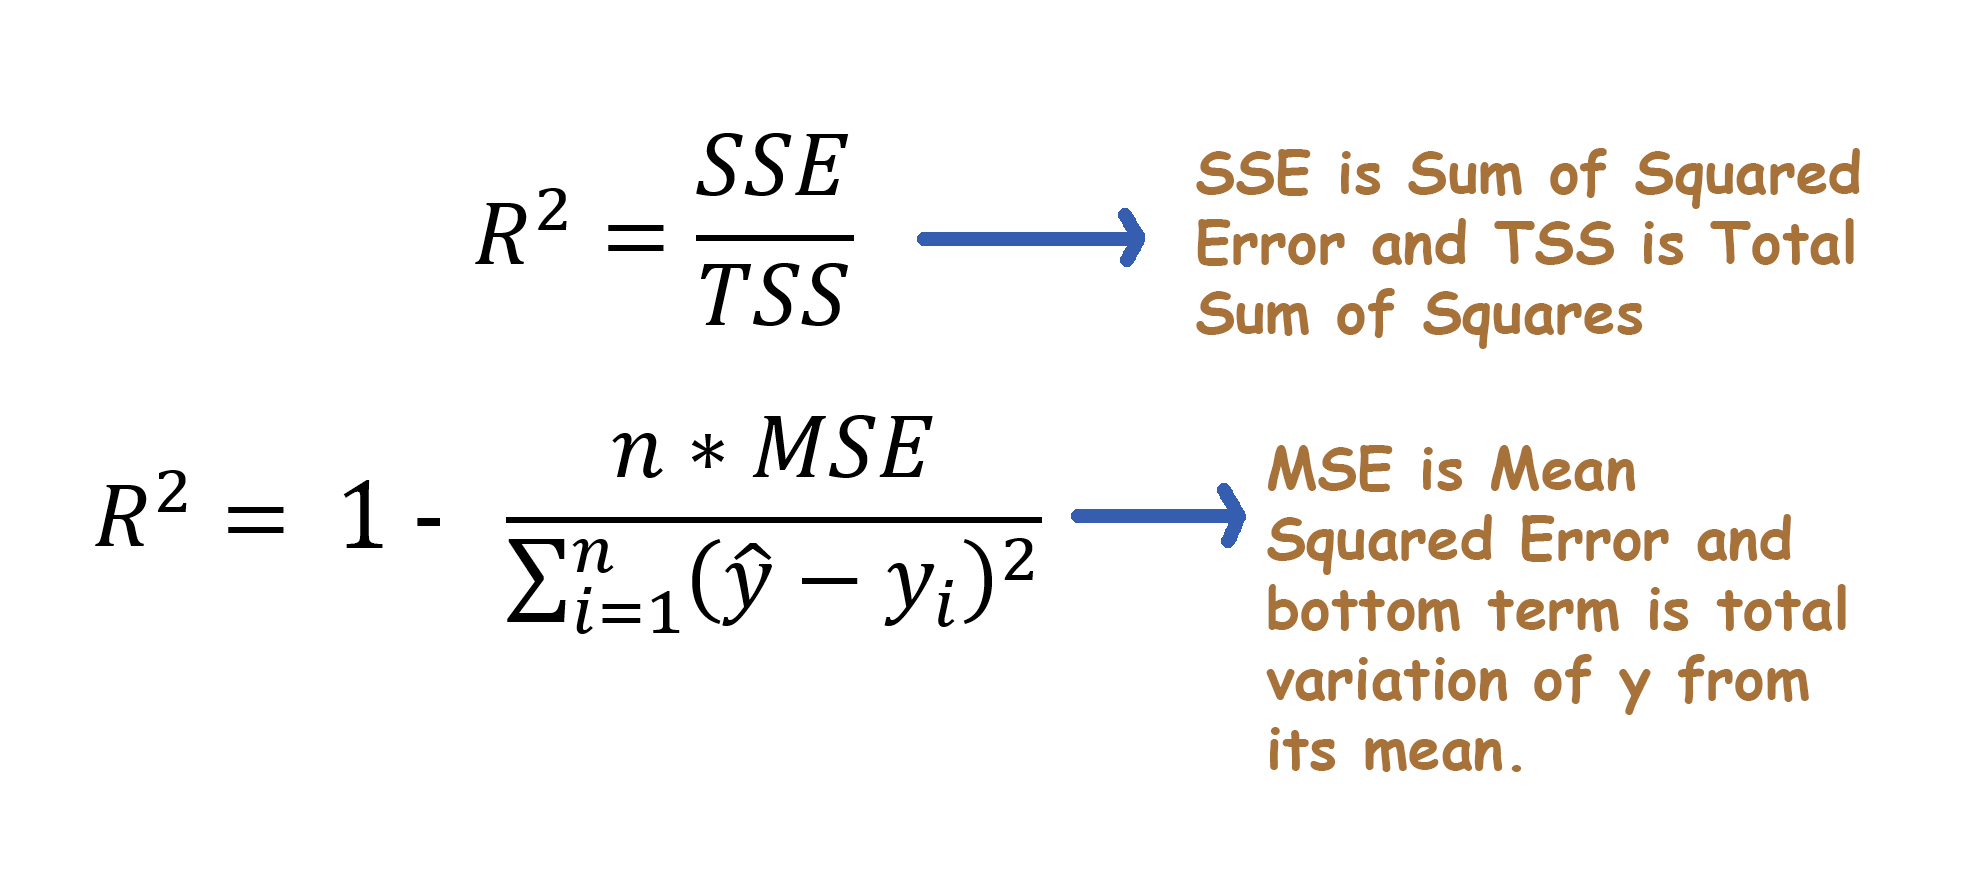
R-squared can be obtained by subtracting the division of Sum of Squared Error(SSE) and Total Sum of Squares(TSS), from one. Sum of Squared Errors is equal to sum of residuals^2. Total Sum of Squares is obtained by taking the sum of differences between the target variable values and its mean. TSS is called as total variation in target variable(y). Thus, we can see that R-squared is directly dependent on Sum of Squared Error(SSE). So, lesser the model’s SSE value is, higher the model’s R-squared value is.
R-squared is also defined as the ‘how much of the total variation is described by the regression line’ or ‘how much of the total variation in outcome target variable(y) is decribed by the independent predictors(x).